Skip to content

Case study · E-commerce

A cosmetics brand, €30,000 of advertising, and a ROAS confirmed in the back office of 2.29x

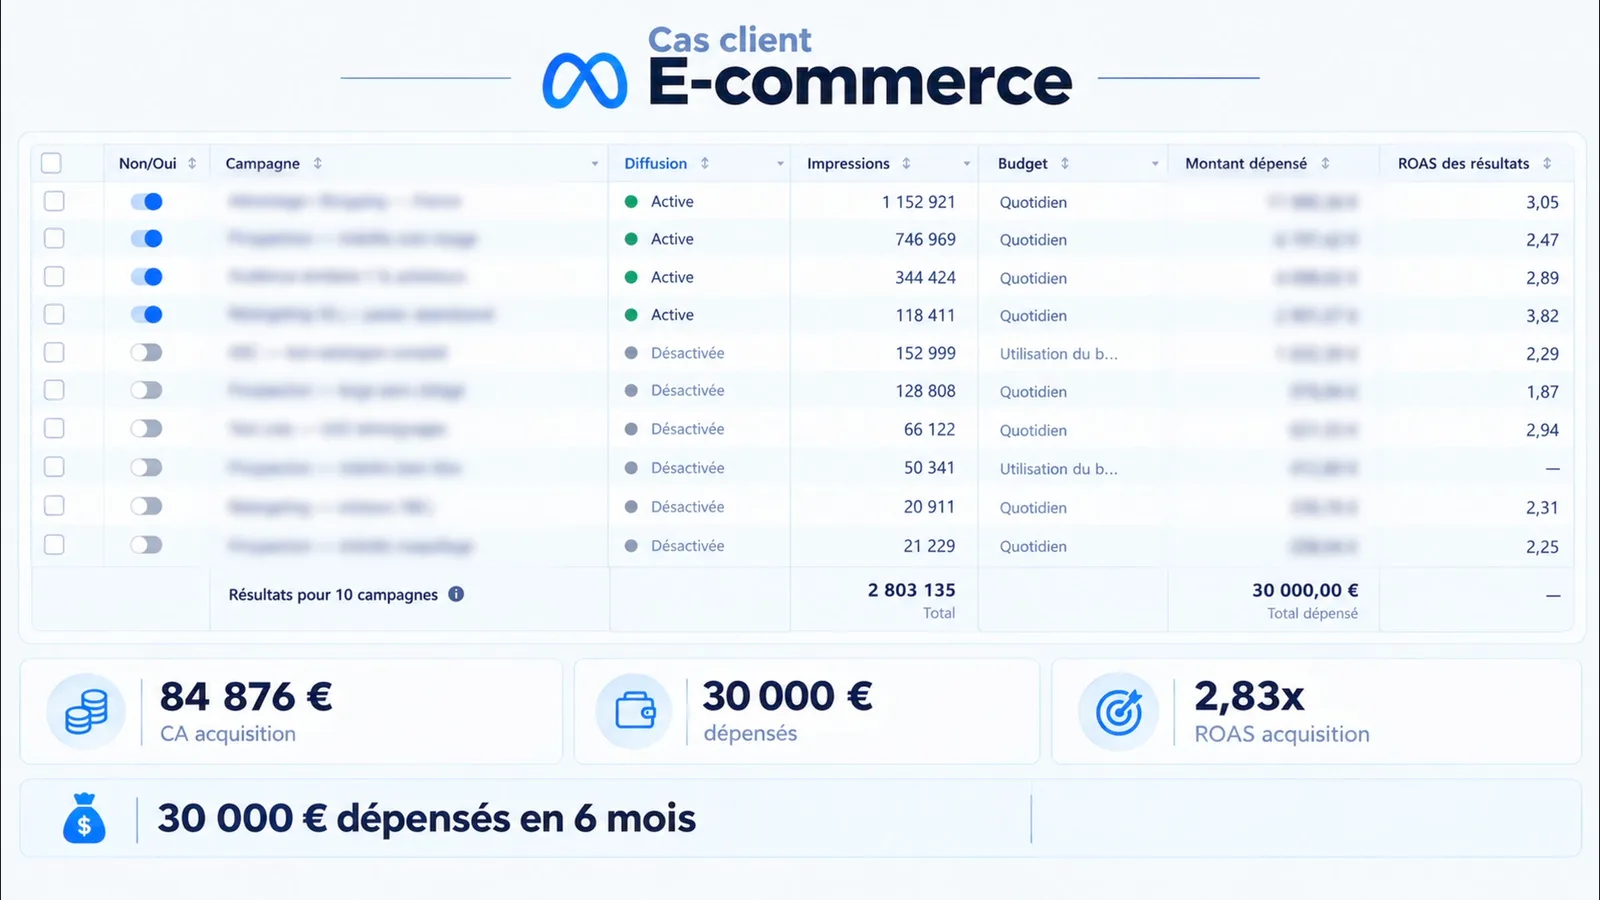
Budget stepped up from €2,000 to €7,500 a month, average order value moved from €54 to €68 through bundles. Meta reports 2.83x, the brand’s accounts confirm 2.29x.

2.29x
ROAS confirmed in the back office
2.83x
ROAS reported by Meta
1.64x
the brand’s break-even point
€18,443
net result for the brand, repeat purchases included
Meta Ads Manager: 10 campaigns, 2,803,135 impressions, €30,000 spent, acquisition ROAS 2.83x for €84,876 of revenue.
Visual rebuilt from the real Meta Ads Manager screenshot and redrawn so it stays readable. The campaign names are blurred, the figures are reproduced exactly as they are.
Both ROAS measurements clear the 1.64x break-even point.Break-even 1.64xMeta 2.83xAccounts 2.29xBoth clear the bar.
Both ROAS measurements clear the 1.64x break-even point.

The context

A cosmetics brand selling online. The ad budget was stepped up over six months, from €2,000 to €7,500 a month, for €30,000 in total. Average order value moved from €54 to €68 by pushing bundles.

The two ROAS, and why they differ

Meta reports 2.83x. The brand’s back office confirms 2.29x. The gap comes from the way Meta attributes sales: it claims some it watched happen without having caused them, and it does so on every campaign of every advertiser.

That is why both figures are here. Steering on the Meta dashboard alone means steering on the more flattering of the two.

At the confirmed ROAS of 2.29x, €30,000 of advertising corresponds to about €68,700 of revenue. That is a calculation (2.29 × 30,000), not a figure read from the ads manager.

The break-even point

This brand breaks even at 1.64x. Both measurements clear it: the campaign is profitable on either reading, and the decision to raise the budget held on both.

A break-even of 1.64x corresponds to a gross margin of about 61% (1 divided by 1.64). The threshold is always worked out that way, from the margin, and never from a ROAS that merely looks good.

What moved the basket

Average order value went from €54 to €68 by pushing bundles. At the same ad spend, that is about 26% more revenue on the same number of orders.

That lever belongs to the offer and the page, not to the advertising itself. It is worked on before raising the budget.

What the net result contains

Repeat purchases included, the brand makes €18,443 of net result. That figure includes the later orders of customers acquired through the advertising.
This case looks like yours if

  • You sell online and already run advertising, or are about to
  • You do not know which to believe, Meta or your accounts
  • You want to raise your budget without risking losing money
  • You know your gross margin, or can work it out

Questions about this case

Why do Meta and my accounts give two figures?
Because Meta credits itself with sales it watched happen, including some it did not cause. The solid reference is what you actually took in.
What ROAS should I aim for?
One above your break-even, which is 1 divided by your gross margin. At a 40% margin the threshold is 2.5x. A ROAS that looks fine can still lose you money if it sits under your threshold.
Can my average order value move that much?
It moved at this brand through its bundles. I do not promise the same for you: it depends on what you sell and how you present it. It gets looked at before spending more on advertising.

Related articles

We start from your margin, not your ROAS

Average order value, gross margin, repeat rate. From there we know the ROAS you have to reach for advertising to pay.

Ads for e-commerce Freelance Meta Ads
Message me on WhatsApp